Last time, I showed you how to profile your application and find the place which slows it down — bottleneck. It helps a lot with finding the place in the code that executes slow, so you can fix that.
But, what if you don’t know how to fix that? How to find the reason for de-optimization in your JavaScript code when you have a lot of different variants of that de-optimization. How to trace specific de-optimizations in your code?
Trace de-optimizations
V8 has a special flag for these cases — trace-deopt. What can it do? It logs into the console information about every function that has been de-optimized. Also, there are handy flags like trace-opt and code-comments, that you can use besides trace-deopt.
Let me show you a simple example, which is obvious, but we are doing it for educational purposes. Try/catch block is always a de-optimization for V8 (at least for now); that’s why I’ve chosen it.
function deopt(a, b) {
  try {
    return a + b;
  } catch (e) {
    // in case of error do something
  }
}

for (var i = 0; i < 100000000; i++) {
  deopt(1, 2);
}
Looks like a normal function, right? But, run this example with the following flags:
node --trace-deopt --trace-opt test.js
You’ve got a few lines like [disabled optimization for *, reason: *]. Now, look at the bottom and you will find the output similar to this one:
[disabled optimization for 0x28b793a53101, reason: TryCatchStatement]
It tells us that our function, named deopt, has been disabled for optimization because of TryCatchStatement. This means that V8 will not optimize this function literally.
What if we remove the try/catch statement?
function deopt(a, b) {
  return a + b;
}

for (var i = 0; i < 10000000; i++) {
  deopt(1, 2);
}
Run again node with tracing flags:
node --trace-deopt --trace-opt test.js
You will not see here that our deopt function has been de-optimized. In fact, you find that it has been optimized:
[marking 0x14dd80c7ac9 for recompilation]
[compiling method 0x14dd80c7ac9]
[optimizing 0x14dd80c7ac9]
[completed optimizing 0x14dd80c7ac9]
Now, we are sure that our function deopt has been optimized by Crankshaft.
The flags trace-deopt and trace-opt help us find de-optimizations or to be sure that our function has been optimized. Also, it tells us why de-optimization happened. In our case, it happened because of the try/catch statement. When we removed it — functions became optimized.
That was a simple example, but it becomes difficult to find de-optimizations in big projects, when you have a lot of code and running node with these flags will spam your console with a lot of information, so difficult to find what you are looking for.
Luckily, thanks to Vyacheslav Egorov, we have IRHydra.
IRHydra
IRHydra is a tool that can display intermediate representations of your code used by V8 optimizing compilers. It’s worth noting that IRHydra works only in Google Chrome because it uses V8 API.
We need to run node with more flags, because we need to trace intermediate representations too, not only de-optimizations:
node --trace-hydrogen --trace-phase=Z --trace-deopt --code-comments --hydrogen-track-positions --redirect-code-traces --redirect-code-traces-to=code.asm test.js
Running the following command creates two files in the current folder: code.asm and hydrogen.cfg. You need to pass these files into IRHydra via Load Compilation Artifacts button in the left top corner.
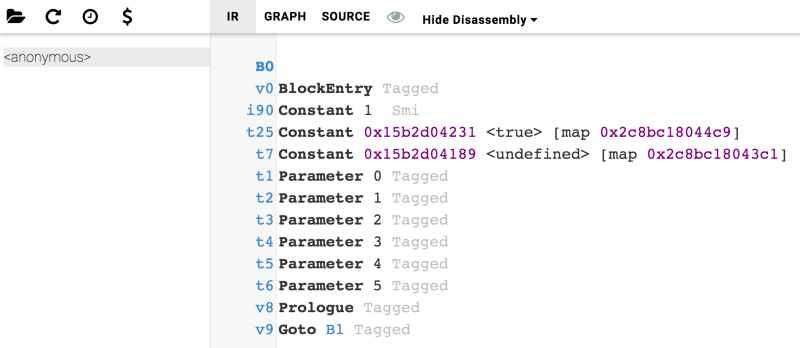
Since our example with try/catch is too simple, there will be only one anonymous function. That is not so interesting.

So, I’ve run complex example from one of my projects — KittikJS — engine for creating ASCII presentations in your terminal. Here is a link to snippet I’m running under those flags.
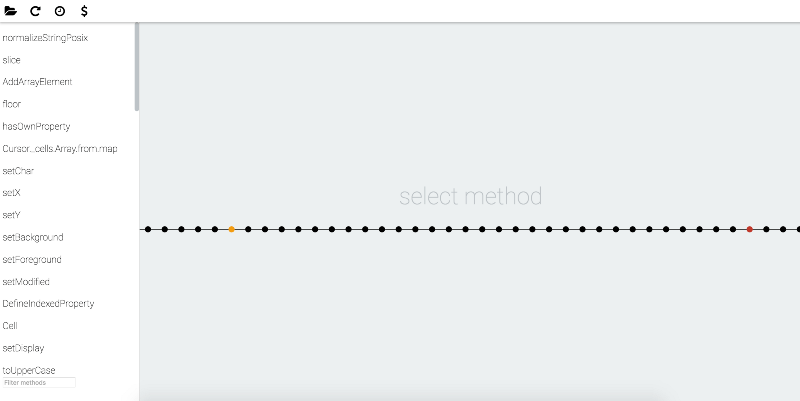
Providing IRHydra with artifacts I’ve collected, I’m getting the following picture:

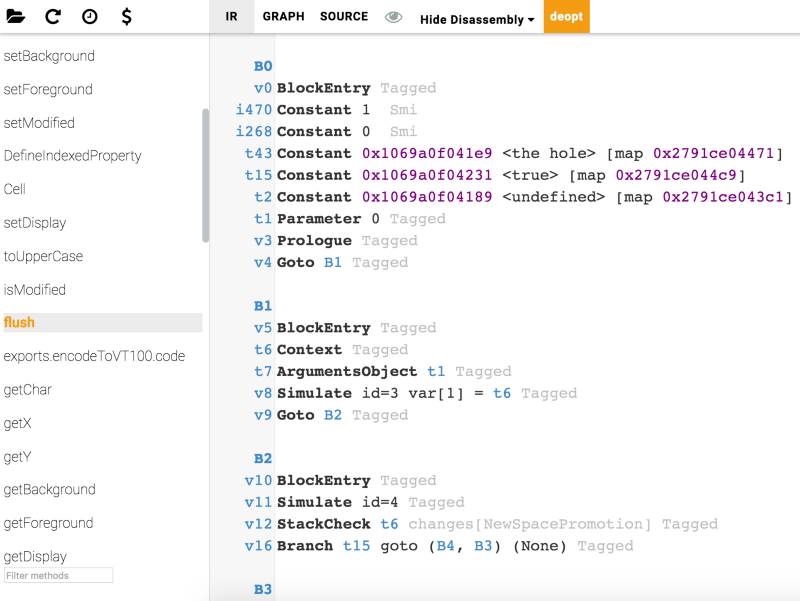
As we can see, there are many functions. How to find de-optimizations here? Well, simple. IRHydra marks de-optimized functions with different colors, based on type of de-optimization. If you look through the functions list at the left, you can find a marked function and click on it:

If function is de-optimized, IRHydra notifies you about this with the deopt button in the top. Hovering mouse over this button shows you a description of de-optimization and why it happened:

So, we know about the flush method. We know why de-optimization happened. Knowing why de-optimization happened and where helps you a lot in resolving this issue.
We can talk a lot about resolving de-optimizations, but it’s a tough and long talk. The main goal of this article is to show you a way to find de-optimizations in your code.
You can try this right away with your current project and see what happens. The idea remains the same for any project, environment or whatever is: run node with the described flags -> collect the artifacts -> open them in IRHydra -> see where you have de-optimizations and try to fix them.
Also, do not optimize the whole project, do not ill with premature optimizations. Good luck!
Thanks for reading. I hope this article shows you a new way to profile Node.js applications and find the slow places.
Eugene Obrezkov, Developer Advocate at Onix-Systems, Kirovohrad, Ukraine.


Comments